Showing posts with label statistics. Show all posts

Sunday, March 24, 2019

Learn to embrace uncertainty

In graduate school, it seemed like the faculty expected me to go the quantitative route, because of my background in electrical engineering. Statistical modeling and, more importantly, GIS, which was in its infancy back then.

I couldn't care about those data-based inquiries.

Because, I was convinced that the human condition that I was interested in learning and thinking about was beyond mere data.  Further, I even made fun of how the data were used in the publish-or-perish academic culture: Faculty and students were more often than not playing with data and seeing if anything would come out of it, instead of thinking through the issues and then using the data.

As with everything else, I chose the losing route.

Graduate students who specialized in data-based research techniques and GIS moved on to good jobs in academia and outside.  I struggled to find a job!

I did continue to criticize the publish-or-perish culture that encouraged fooling around with data and statistical software, which was getting to be more and more sophisticated.  All these were before "big data."

I now feel vindicated.  Phew!

Pissed off scientists have risen up in their opposition to the abuse of statistical significance:
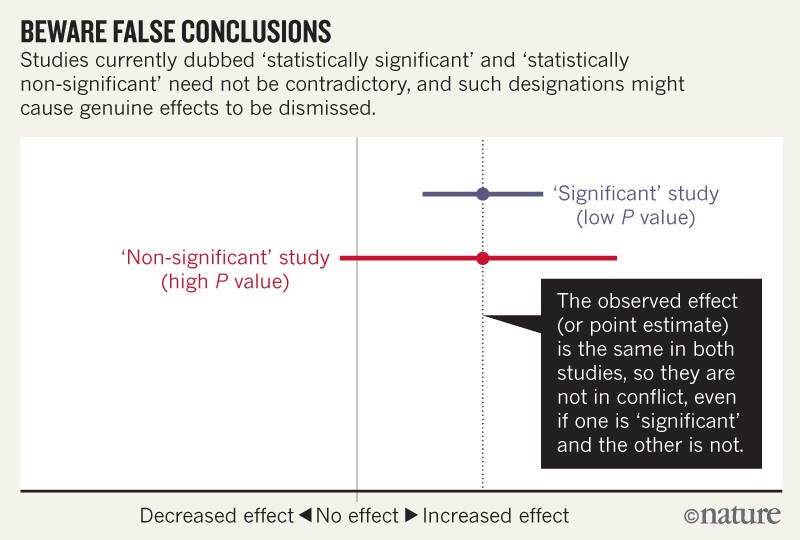
Source

The authors--"more than 800 signatories"--want researchers to quit categorizing:
The trouble is human and cognitive more than it is statistical: bucketing results into ‘statistically significant’ and ‘statistically non-significant’ makes people think that the items assigned in that way are categorically different ...
On top of this, the rigid focus on statistical significance encourages researchers to choose data and methods that yield statistical significance for some desired (or simply publishable) result, or that yield statistical non-significance for an undesired result, such as potential side effects of drugs — thereby invalidating conclusions.
Note how they phrased it? "encourages researchers to choose data and methods that yield statistical significance for some desired (or simply publishable) result" is exactly what I did not find appealing back in graduate school!

More from the authors:
The objection we hear most against retiring statistical significance is that it is needed to make yes-or-no decisions. But for the choices often required in regulatory, policy and business environments, decisions based on the costs, benefits and likelihoods of all potential consequences always beat those made based solely on statistical significance.
Exactly!

And even more important is this point from the authors on what will happen if we got rid of our focus on statistical significance:
Decisions to interpret or to publish results will not be based on statistical thresholds. People will spend less time with statistical software, and more time thinking.
More time thinking.  What a concept!

Friday, August 01, 2014

Sports: The reason you're like this

A fresh off the boat immigrant I was quite some years ago, and with no prior exposure to the uniquely American sports of football and baseball.  No athlete I ever was, nor pretended to be one, yet, practically from the first day, I took to baseball and football, as the proverbial fish to water, which is a hilarious metaphor to employ given that I swim like a rock!

To follow baseball without ever having played it perhaps fits in well with how the game appeals to nerds.  As I would find later in the essays by Stephen Jay Gould--ah, I miss his writings--there was quite some poetry in the game and in the statistics.  Lord Kelvin famously declared that to measure is to know and anything that could not be measured was not worth knowing.  Baseball offered a gazillion measurements, but the beauty of the sport was how all that measurement often meant nothing.

I fell in love with baseball (A dangerous sport characterized by long periods of daydreaming, punctuated by intense bursts of unmanageable violence, panic, and people screaming at you.)   The love was cemented because the worthlessness of all those measurements was spectacularly demonstrated in my early, early years as a green graduate student.

source
I had picked up enough about baseball to follow the box scores in the Los Angeles Times as a daily ritual.  Even more exciting it was to scan through the detailed numbers in the Sunday edition.

And then came the 1988 season.  What glorious inning after inning! (The amount of time left before afternoon snack, divided by nine.)

Kirk Gibson was the story from the beginning.  The Dodgers signed him on and commentators worried that his attitude would not resonate with the team.  Surely enough, he had problems with his new teammates from the get go.

As the season progressed, the Dodgers  weren't picked by many to win it all.  The statistics did not favor them.

But, there was something happening.  Like Orel Hershiser's unhittable pitching.

The Dodgers won the division title.
The statistics favored the Mets in the league championship. Again, all the numbers pointing to the Mets' superiority became irrelevant.
And thus it was the ultimate all-California final, with that famous hitting duo, whose later drug-enhanced performances at the plate produced some towering home runs. (Something that you genuinely believe will happen when you swing. Every single time you swing. Even though it has never happened, you still think it will. You are so funny sometimes.)

All the numbers made it clear that the Dodgers were the underdogs among underdogs.

It couldn't have been any more of a Hollywood storytelling than that.  Nobody could have predicted that there was more Hollywood drama to come.

It was the bottom of the ninth.
The Dodgers were trailing with two outs.
One more out and the teams would meet again.
The injured and hobbling Gibson was sent in as a pinch-hitter.  (Something that you and your teammates request for you but cannot have.)

The rest, as they say, was history.


(The title of this post and the italics in parenthesis are all from this wonderfully humorous piece in the New Yorker on a glossary of baseball terms.)

Friday, August 16, 2013

Coincidence? What are the odds!

I bet we all have plenty of stories to tell about lucky, and unlucky, coincidences.  This post on the fifteenth of August is one of those.  When such coincidences happen, we wonder what the odds are.

Life is all about probability, as an academic acquaintance back in my Bakersfield days always liked to point out.  The odds of winning the lottery, or the odds of a plane accident, or the odds of meeting a redhead who is drawn to me.  (Zero, in the last case, as any illiterate person would even guarantee!)

The fact that we are alive, and Earth has life as we know it, is itself one heck of a demonstration of a random occurrence; as Steven Pinker put it in a different context:
We know that we live on a planet that revolves around one of a hundred billion stars in our galaxy, which is one of a hundred billion galaxies in a 13.8-billion-year-old universe, possibly one of a vast number of universes. We know that our intuitions about space, time, matter, and causation are incommensurable with the nature of reality on scales that are very large and very small. We know that the laws governing the physical world (including accidents, disease, and other misfortunes) have no goals that pertain to human well-being. There is no such thing as fate, providence, karma, spells, curses, augury, divine retribution, or answered prayers—though the discrepancy between the laws of probability and the workings of cognition may explain why people believe there are. And we know that we did not always know these things, that the beloved convictions of every time and culture may be decisively falsified, doubtless including some we hold today.
It is all one freaky set of events.  Coincidences are no different that way.  The more we interact,. the more we can expect coincidences.  As our interactions have grown geographically, and over time thanks to the long lifespans, and with the cyberspace now, well, we could certainly expect a lot more coincidences.
We are exposed to possible events all the time: some of them probable, but many of them highly improbable. Each rare event—by itself—is unlikely. But by the mere act of living, we constantly draw cards out of decks. Because something must happen when a card is drawn, so to speak, the highly improbable does appear from time to time.
It is elementary, my dear Watson!
It is the repetitiveness of the experiment that makes the improbable take place. The catch is that you can’t tell beforehand which of a very large set of improbable events will transpire. The fact that one out of many possible rare outcomes does happen should not surprise us because of the number of possibilities for extraordinary events to occur. The probabilities of these singly unlikely happenings compound statistically, so that the chance of at least one of many highly improbable events occurring becomes quite high.
Makes sense, doesn't it.

But then, remember that wonderful quote about statistics?  There are lies, damn lies, and statistics?  In this case, it is not the numbers that lie, but our own minds.  Humans that we are, we prefer to build a narrative that makes order out of the chaos that the world is.  We like convincing stories, with a beginning, a middle, and a happily ever after.
The devil is in the details of how we interpret what we see in life. And here, psychology—more so than mathematics or logic—plays a key role. ... And we also seem to be hardwired to exaggerate the chance events in our lives—because they provide us with good cocktail party stories. Psychological factors can well mask the probabilistic reality. All these factors, mathematical, interpretational, and psychological, affect how we view and understand the rare events in our personal lives.
We engage in a sleight of hand. I don't think we mean to deceive anybody--instead, I think it is our way to deal with life.

Further, because a life is lived only once, we cannot engage in any controlled experiments anyway, in order to test out any hypothesis related to coincidences.  Instead, we merely listen to charming anecdotes, and marvel at the coincidence that you and I are both alive at the same time!

Sunday, December 05, 2010

200-year economic history of 200 countries in 4 minutes

I have used many of Hans Rosling's videos in my classes, ever since I watched the first TED talk of his.  While most of the students are, well, students who are indifferent to anything (even my awful puns!) there are always a few who are blown away by his explanations.
I am sure I will use the following next term (and after too?) ... ht

Tuesday, February 23, 2010

"Statistically significant" global warming

Have you ever wondered what "statistical significance" means? Particularly in the context of climate change?  The video here provides a fantastic explanation of the concept and its application in global warming.

Friday, February 05, 2010

Every third Indian is poor :(

Every third Indian is living below the poverty line, estimates an expert group saying that more than 37 per cent of people are poor, ten per cent more than estimated earlier.
Among the states, Orissa and Bihar are at the bottom, while Nagaland, Delhi and J&K have the least number of poor, says a report by the expert group, headed by Suresh Tendulkar, former chairman of PM’s Economic Advisory Council.
That is the report.  Of course, if beauty is in the eye of the beholder, then poverty, too, depends on the number cruncher:
According to the Planning Commission’s recent estimates, poverty in India came down from 35.97 per cent in 1993-94 to 27.54 per cent in 2004-05.
Although the Tendulkar report has estimated the poverty at 37.2 per cent against the Commission’s estimate of 27.5 per cent, it did say the estimates are “not comparable” as the former is based on new basket of goods.
No wonder we cite the quote that there are lies, damned lies, and statistics!  Who you gonna believe?

Saturday, August 29, 2009

SAT scores related to bathrooms in the house?

Greg Mankiw:
The NY Times Economix blog offers us the above graph, showing that kids from higher income families get higher average SAT scores.

Of course! But so what? This fact tells us nothing about the causal impact of income on test scores. (Economix does not advance a causal interpretation, but nor does it warn readers against it.)

This graph is a good example of omitted variable bias, a statistical issue discussed in Chapter 2 of my favorite textbook. The key omitted variable here is parents' IQ. Smart parents make more money and pass those good genes on to their offspring.

Suppose we were to graph average SAT scores by the number of bathrooms a student has in his or her family home. That curve would also likely slope upward. (After all, people with more money buy larger homes with more bathrooms.) But it would be a mistake to conclude that installing an extra toilet raises yours kids' SAT scores.

It would be interesting to see the above graph reproduced for adopted children only. I bet that the curve would be a lot flatter.
Hmmm..... IQ and genes. Controversial, right? Of course. Because this is an unsettled issue in science. Conor Clarke remarks that "the vaguely deterministic suggestion that smart parents "make more money and pass those good genes on to their offspring" is a laughably crude description of how real life works" and cites a study by Richard Nisbett and notes that:
children born to wealthy parents and raised by downscale families have almost exactly the same IQ range as children born to downscale parents and raised by wealthy families. Nisbett uses this to make what I thought would have been an entirely uncontroversial point -- namely, that "both genes and class-related environmental effects are powerful contributors to intelligence"
Shall watch out for the next round of this discussion :-)

Thursday, August 06, 2009

"Statistics" not "plastics"

In 1967, the career advice to The Graduate (Benjamin) was:
Mr. McGuire: I want to say one word to you. Just one word.
Benjamin: Yes, sir.
Mr. McGuire: Are you listening?
Benjamin: Yes, I am.
Mr. McGuire: Plastics.
Now, forty years later, apparently it is "statistics". The article notes that "Computing and numerical skills, experts say, matter far more than degrees." I will add this to my ongoing critique of college education as we have it now.

“I keep saying that the sexy job in the next 10 years will be statisticians,” said Hal Varian, chief economist at Google. “And I’m not kidding.”

The rising stature of statisticians, who can earn $125,000 at top companies in their first year after getting a doctorate, is a byproduct of the recent explosion of digital data. In field after field, computing and the Web are creating new realms of data to explore — sensor signals, surveillance tapes, social network chatter, public records and more. And the digital data surge only promises to accelerate, rising fivefold by 2012, according to a projection by IDC, a research firm.

Yet data is merely the raw material of knowledge. “We’re rapidly entering a world where everything can be monitored and measured,” said Erik Brynjolfsson, an economist and director of the Massachusetts Institute of Technology’s Center for Digital Business. “But the big problem is going to be the ability of humans to use, analyze and make sense of the data.”

The new breed of statisticians tackle that problem. They use powerful computers and sophisticated mathematical models to hunt for meaningful patterns and insights in vast troves of data. The applications are as diverse as improving Internet search and online advertising, culling gene sequencing information for cancer research and analyzing sensor and location data to optimize the handling of food shipments.